
In AI world Anthropic recently released Claude 3.7 with extended thinking. The “extended thinking” function is the fruit of a realization in the AI labs that if you give the AI longer to think their responses are more thorough and accurate, so in addition to expanding the compute size you can expand the compute time parameter. Claude is best known for coding and application development, so since the announcement the AI Twitterverse has been exploding with people creating all sorts of (relatively) sophisticated games and simulations using a few lines of prompts.
This has the potential to be a gamechanger in the education space. Previously I used an earlier version of this to create a data visualization of New Testament books by time since Christ and authenticity score, but I had to handload in the information and it took a couple iterations. The newer version generates much more sophisticated material. For example, with a few lines of prompt I created an app that simulates the planetary motions in the solar system, with the ability to adjust the gravity of the different planets. It’s not perfect (you have to unclick “Real Distances” to see anything), but for a couple lines of prompting it’s quite good.
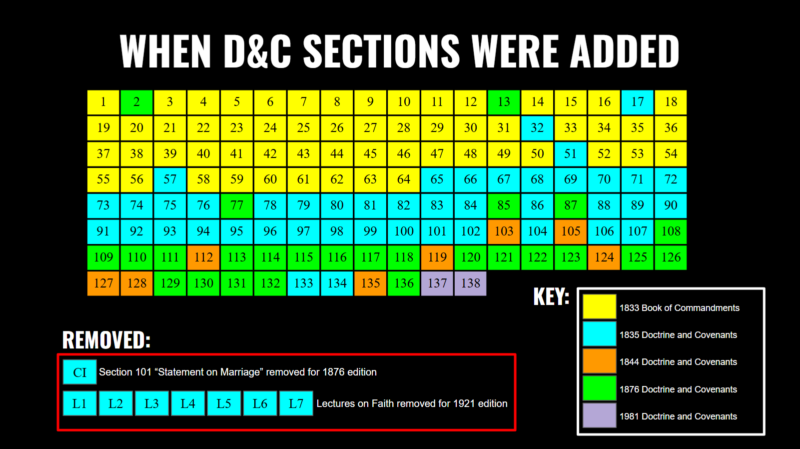
In terms of Church-related content, with our scripture and history we have a number of cases where a really good data visualization is worth ten thousand words. That’s why I’ve appreciated people who take the time to put together pedagogical materials. For some D&C examples, this is a great visualization by Ryan Hinck (source here) for some perspective on which D&C editions had which sections.
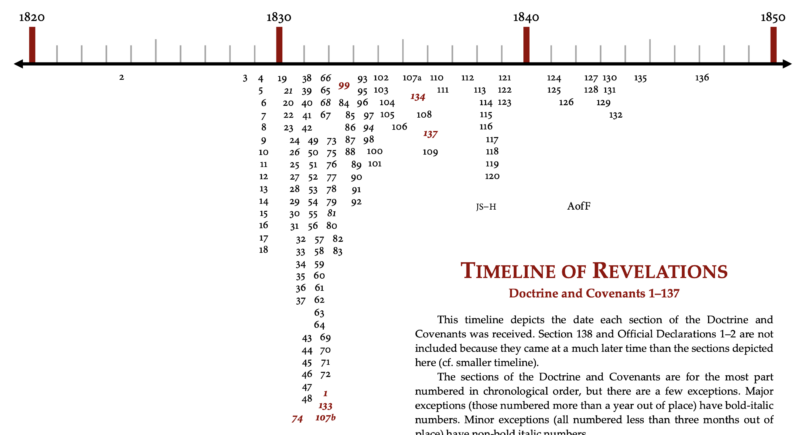
Nathan Richardson has put together another useful visualization showing the early Church history timeline alongside D&C sections (can’t fit it on one page), as well as another plot showing the density of D&C revelations by year.
In terms of typesetting and digital publishing, my friend Ben Crowder has produced a number of different editions of Latter-day Saint scriptures that help one read them through fresh eyes, like a D&C scripture study edition with the sections in chronological order, and a Plates edition of the Book of Mormon. Finally, the award-winning “Mapping Mormonism” project produced dozens of high-quality data visualizations and maps.
So for my small contribution to the gospel data visualization and pedagogy space, I used Claude to produce a number of different fun interactive “apps.” I did not feed any information into it, all of the necessary information was grabbed natively from the training data. You can click on the link to access it and play around with it, but I’ll also be posting screenshots. As you can see, one limitation is it still doesn’t handle images natively; if I hosted the code on Github I could presumably hard code bespoke images in, but that would take more time than I have.
Finally, I haven’t done more than a cursory accuracy check for hallucinations–This is all from the 2-3 line prompt with maybe another 2-3 line iterations afterwards; this is mostly a demonstration of the different pedagogical possibilities we now have.
Book of Mormon timeline showing relative lengths of different books and major events (link). 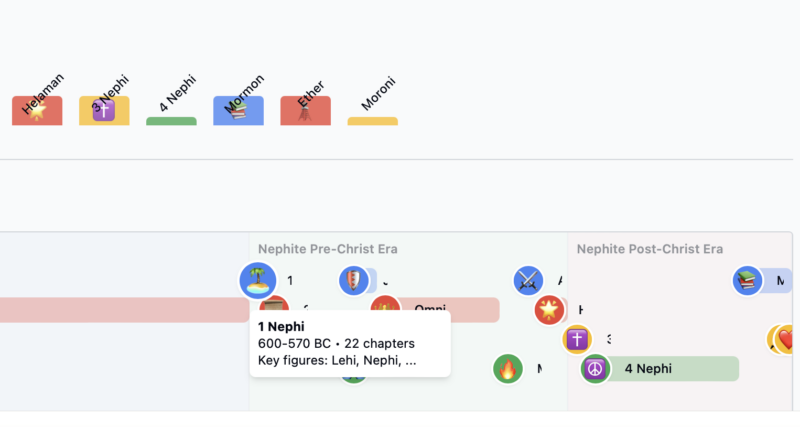
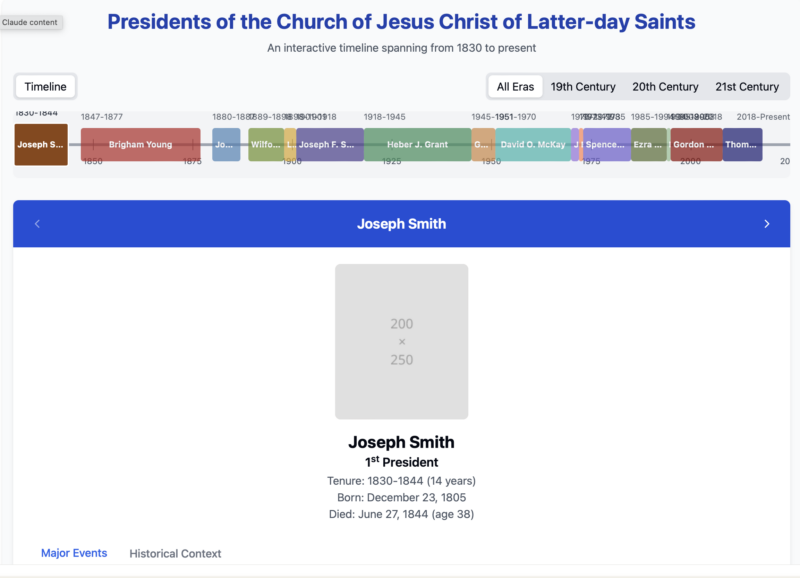
Interactive timeline of the Presidents of the Church (link). And yes, I’m aware it only goes up to Pres. Monson.
Book of Mormon family trees (link).

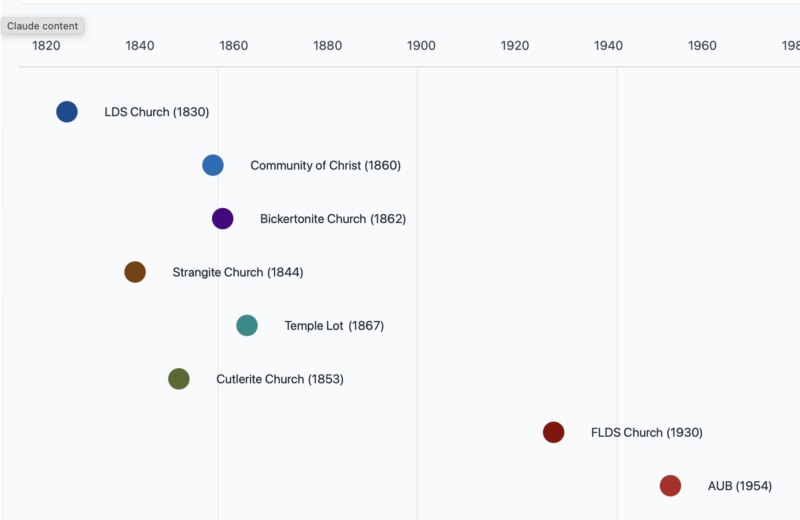
Chart showing relations between between branches of the Latter-day Saint movement (link).
Comments
5 responses to “Claude 3.7, Data Visualizations, and Gospel Pedagogical Tools”
I took a quick look at the Book of Mormon family trees, Lehi’s family in particular. It missed that Chemish is the brother of Amaron, not the son. It describes the Nephites as descendants of Nephi and Sam, ignoring Jacob, Joseph, and their sisters. It also describes the Lamanites as descendants of Laman and Lemuel, ignoring the sons of Ishmael, but that might be excusable in a visualization of Lehi’s family tree.
It says it will denote sibling relationships with dotted lines, but never does. In fact it seems to be under the impression that Laman plus Lemuel and Sam plus Nephi are married couples–the lines between them are identical to the lines between Lehi and Sariah.
So yeah, typical AI, for better and worse.
Right, but any errors can be easily fixed in moments. So yes, it still requires a hand quality check, but after the errors are found it takes a few moments instead of a few hours or days.
Very cool. I saw a visualization of Book of Mormon chapter by year which I used in a lesson once.
Now that solar system simulation is impressive. Seems accurate–I counted and Earth does do about 12 orbits in the time Jupiter completes one. But it’s not just the planets on rails–it’s actually simulating gravity, as you can see if you mess with the sliders at the bottom.
Those do not adjust the gravity on the planet, which would have no effect on what we’re seeing here, but rather the strength of the Sun’s gravitational pull on the planet. That’s bonkers–I can’t think of any educational or other reason why one would simulate what would happen if the gravitational constant suddenly changed, but only on Jupiter. Call it another case of AI not really understanding what it’s working with. But it does get the answer right.
It’s not doing the full N-body problem: if you crank up the gravity on Jupiter it will swoop through the inner solar system without having any effect whatsoever on the inner planets. I’ll bet it’s only simulating the Sun’s gravity and the Sun itself is fixed. That’s not a hard thing to simulate. I was a physics major at one point, and I’ve written this simulation a few times as an exercise while learning a new programming language (and once for my oldest’s middle school science fair project). But for an AI to build it with so little guidance…impressive.
As a non-physicist the simulation helped me grasp the “slingshot” trajectory around celestial bodies that people talk about. I kind of got it intellectually, but seeing the planets leave their orbit and charge towards the sun made me realize it’s just like throwing a ball in the air; I mean, of course it is, but I kind of get it intuitively now.